Session Counts Are a Vanity Metric — What I Track Instead After 3 Years Running a Tutoring Company

What metrics should a tutoring company actually track?
Track student progress, not session counts: how much each student has actually mastered, who’s at risk of cancelling, and what evidence of progress a parent can see. Session counts, attendance and revenue are vanity metrics — they tell you the business ran, not whether it worked. After three years running a tutoring company, the operational numbers I watched most closely turned out to be the ones least able to warn me a client was about to leave.
The numbers that looked fine right up until they didn’t
For my first couple of years, my “business health” check was a row of numbers I could recite from memory: sessions delivered this week, attendance rate, hours billed, revenue against last month. When those were up, I felt good. When a number dipped, I went and fixed it.
More than once, a family cancelled whose numbers had looked completely fine right up until they left — attendance was there, sessions ran on time, invoices were paid. There was no dip to warn me. The row of numbers that was supposed to tell me the business was healthy said nothing at all, right up until the outcome had already happened.
What that taught me is that metrics aren’t people. A dashboard doesn’t have emotions, and tutoring is as much an emotional job as it is an academic one — a family doesn’t stay because a number looked fine, they stay because they trust their child is genuinely being looked after. That’s part of why the review loop runs both ways in my business: parents and students rate and review their tutor after every lesson — that’s genuinely built into ClassQuill, feeding a public rating on the tutor’s profile, not just an internal number — and I’m now building in tutor self-review too, so the feedback runs both directions instead of only one.
That’s what made me realise the problem. My dashboard could tell me a student turned up every week and we got paid. It could not tell me whether that student had learned anything — and “did my child learn anything” is the only question the person paying the bill actually cares about. I was measuring my own operations. The parent was measuring their child’s progress. We weren’t even looking at the same scoreboard.
Why session counts, attendance and revenue are vanity metrics
A vanity metric is a number that looks like success and moves like success but doesn’t predict the outcome you actually care about. In a tutoring company, the outcome you care about is retention — families staying, and staying because the tutoring is working. Here’s why the usual operational numbers fail that test.
Session counts measure effort, not effect. Two hundred sessions a month tells you your tutors showed up and your scheduling works. It tells you nothing about what happened inside those sessions. A student can attend twenty sessions and plateau. The count goes up either way.
Attendance measures presence, not progress. A child can have a flawless attendance record and be quietly falling further behind every week. High attendance with no improvement is actually a worse signal than a missed session — it means the family is paying, turning up, and not getting what they came for. That’s a cancellation with a delay on it.
Revenue is the most dangerous of all — because it lags. Revenue is last month’s decisions showing up in this month’s bank account. By the time a churning client shows up as a revenue dip, they’ve already decided to leave, told the tutor, and served their notice. Revenue is a coroner’s report, not an early-warning system.
The common thread: every one of these numbers goes up when the business is busy and stays up right until the moment a family walks. They are lagging, operational, and silent on the one thing that drives the business — learning.
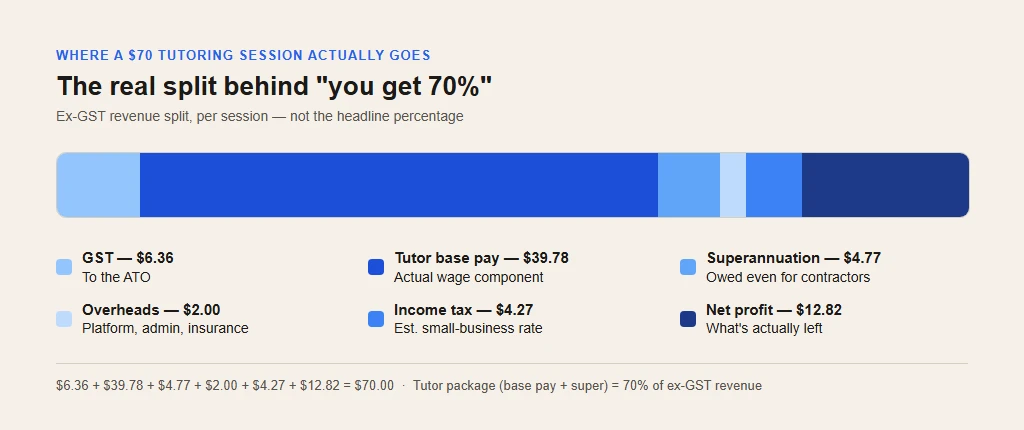
Revenue is deceptive twice over — not just because it lags, but because the headline split misleads too. Take a $70 tutoring session: after GST ($6.36) goes to the ATO, what’s left is $63.64, and the tutor’s package is 70% of that — $44.55. “You get 70%” is the number that can feel unfair to a tutor, right up until you break it down further.
Superannuation is owed on that package even though tutors are engaged as contractors, not employees — the Superannuation Guarantee applies to anyone engaged principally for their labour{target=“_blank”}. So of that $44.55, roughly $39.78 is actual base pay and $4.77 is super the business is required to pay on top, regardless. What’s left on the company’s side — about $19 of gross margin — still has to cover payment-processing fees, overheads, and income tax before anything is actually profit: in this example, about $2 in overheads and $4.27 in tax, leaving roughly $12.82 net. A single percentage hides all of that.
A flow diagram — a chart showing the $70 splitting into GST, tutor base pay, super, overheads, tax, and net profit — makes it legible in a way “you get 70%” never does, and it’s worth showing tutors the real breakdown, not just running the numbers for yourself.
The same unit economics compound past one session. At a typical multi-month tenure — say 20 sessions — that ~$19 of gross margin per session adds up to a few hundred dollars of lifetime margin from one student. Whatever it cost to acquire that student has to be paid back out of that number, which is exactly why cost-of-acquisition is worth tracking by channel rather than assuming word-of-mouth is free — it costs time, even when it doesn’t cost ad spend. If you want to run your own numbers before you build a KPI system around them, ClassQuill’s free pricing estimator does this same margin math for your own rates.
The metrics I track instead
These are the tutoring KPIs I actually track now — leading indicators, signals that move before a family decides, while there’s still time to do something. They’re harder to read than a revenue figure, but they’re the ones that actually forecast whether a client stays. The first four are a weekly check; the fifth is monthly.
1. Mastery movement, per student, weekly — not “did they attend”, but “did anything move”. Has at least one topic moved forward — shaky to solid, or a new topic touched — in the last two weeks? The unit I care about is the topic, not the session. A student whose mastery map is filling in is a student who’ll stay. A student whose map has been static for three weeks or more is a churn risk wearing a perfect attendance record, and that’s the trigger to check in with the tutor before the next session.
2. The at-risk list, weekly. This is the single most valuable list in the business and it didn’t exist on my old dashboard. A student gets flagged when two or more of the following are true: no mastery movement in 3+ weeks, homework completion under 50% over the last two sessions, two consecutive assessments trending down, or the tutor has manually flagged a concern. When a student’s flagged, I follow up with the tutor that week; if it’s not resolved, a direct parent check-in within seven days — before it turns into a cancellation conversation instead of a catch.
3. Evidence a parent can see — progress made visible, not asserted, checked weekly. Retention isn’t just about whether the child improved; it’s about whether the parent can see that they improved, and has actually looked in the last 30 days. A parent who can watch the mastery map fill in renews without thinking about it. A parent who’s just told “yeah, they’re doing well” cancels the first time money gets tight. If a family hasn’t opened the progress view in 30 days, the trigger is to have the tutor walk them through it live at the next session — visibility only counts if it’s actually been seen, not if it exists.
4. Quality consistency across tutors, checked monthly — is the experience the same with every tutor. Once you have more than a few tutors, your biggest hidden risk is variance: one tutor produces real progress, another is just running out the clock, and from the front the company looks identical. So I compare each tutor’s roster against the company’s average mastery-progress rate. A tutor trending 20%+ below average for two consecutive months triggers a training or pairing conversation — not a warning on the first instance, since one slow month is normal. I haven’t had to act on this one yet, which is the point of building it in before it’s needed rather than after a parent complains about a specific tutor.
5. Review signals, both directions, ongoing. Every metric above is about the student’s learning. This one is about whether the experience around that learning is healthy. Parents and students rate and review their tutor after every lesson, feeding a public profile rating rather than sitting in an internal spreadsheet — any session rated 3 stars or below triggers a same-week personal call with the family, not an automated email. I’m also now building tutor-side self-review into the same loop, so the feedback runs both directions instead of only one. Metrics measure whether a student is progressing; review signals measure whether the relationship carrying that progress is a good one — and both predict retention, just from different sides of the desk.
Why this list looks different from the usual “tutoring KPI” checklist. Most advice aimed at tutoring business owners covers a different layer entirely: lead flow, enquiry-to-trial conversion, tutor utilisation, attendance and cancellations, revenue per student and lifetime value, admin overhead, and a periodic parent satisfaction survey. Those are real numbers, worth tracking for a different reason — they tell you whether the business is running efficiently.
But none of them look inside a session to ask whether a student actually learned anything, and a satisfaction survey is still a lagging self-report — a parent says they’re happy right up until they’re not. The five signals above aren’t a replacement for operational tracking. They’re the layer underneath it that the standard checklist skips.
Free download: The Tutoring KPI & At-Risk Checklist (PDF) → — all five signals with cadence and action thresholds, ready to run against your own roster.
What actually changes when you measure this instead?
The shift isn’t really about the dashboard. It’s about when you find out a family is unhappy. On operational metrics, you find out at cancellation — the number moves after the decision’s already made. On learning signals, you find out while there’s still a session left to do something about it: a stalled mastery map or a dropped homework-completion rate shows up weeks before a parent has decided to leave.
I’ve only just built this system in fully, so I don’t have a multi-month before/after yet — a retention number that’s moved, or a specific save I can point to. What I can say honestly is what used to be invisible now isn’t: I couldn’t previously have told you which active students hadn’t touched a new topic in a month, or which families hadn’t opened their child’s progress view all term. Now I can, every week, without having to remember to ask a tutor.
The honest caveat: learning signals are harder to track than operational ones. Sessions and revenue count themselves. Mastery and at-risk status only exist if homework is marked, results are captured, and it all rolls up per student instead of living in a tutor’s head or a notebook. For a long time I tracked the wrong things partly because the wrong things were the easy things to measure — they were already in the calendar and the invoicing tool.
Before I had a system built around this, I was doing it the way most operators start out: notes app, text messages, email. It works when you have three students. It falls over fast once you’ve got more than a handful across more than one tutor — a shaky topic mentioned in a text thread three weeks ago doesn’t roll up into anything, and there’s no way to see it unless you remember to go looking. Getting the learning signals took building the measurement in deliberately, not just writing things down somewhere.
How do I actually track this now?
This is the part I won’t pretend was easy by hand. Marking homework, capturing every result, and rolling it up into a per-student mastery view that a parent can also see — that’s a lot of manual work, and it’s the first thing that falls over once you’ve got more than a handful of students across more than a handful of tutors.
I run my tutoring company on ClassQuill, which is built around exactly these signals rather than around session counts. Tutors set homework from a curriculum-aligned question bank; it’s auto-marked, and every result feeds a topic-by-topic mastery profile for each student. That rolls up two ways that matter to me as an owner: parents get a progress view they can actually see, and I get a cross-tutor view of who’s progressing and who’s slipping — the at-risk list I wish I’d had years ago.
I’m biased — I built my company’s operations on it. But the argument stands on its own whatever you use to measure it: track what students are learning, not just that sessions happened. The operational numbers will tell you the business is busy. Only the learning signals will tell you it’s healthy.
Related reading: